
News Release
Mercer Marsh Benefits™ launches digital solution BenefitMAP™ to help employers address rising healthcare plan costs
- Global medical costs increased on average 9.5%[1]* in 2017, nearly three times the estimated inflation rate in major economies
- While employers are increasingly impacted by complex employee health benefits challenges, they are often unable to quantify cost
- Adopting a holistic, anticipatory approach to employee benefits risk with BenefitMAP will help employers manage cost and improve outcomes
To enable organizations to better manage the increased risk and complexity associated with the costs of their employee healthcare benefit plans, Mercer Marsh Benefits™, Marsh & McLennan Companies’ international employee benefits business, today announced the launch of BenefitMAP™. A global digital platform, BenefitMAP uses a combination of data, analytics, and technology to provide employers with an anticipatory approach to managing the costs associated with their benefits programs.
With medical costs of private plans increasing at almost three times inflation in most major economies, companies are facing complex healthcare challenges that can materially affect their ability to grow.
Combining benchmarking data with plan design elements that are calculated based on local conditions, BenefitMAP enables organizations to identify savings tailored to their specific needs. Companies can also project their plan costs with greater certainty by incorporating trends such as historical experience and medical inflation, as well as Mercer Marsh Benefit's proprietary aging factor. BenefitMAP incorporates specific market conditions, regulatory factors, price-driving local variables, and claims benchmarking data covering all geographies, for a global view of a clients program.
“We are now in a position to better quantify the value and return on employer-sponsored employee benefit plans that clients expect,” said Andrew Perry, Managing Director, Mercer Marsh Benefits. “In an industry that is rapidly evolving, BenefitMAP gives employers real-time understanding of their benefits budgeting options and puts their capital to optimal use.”
“By delivering transparent historical and future views into a company’s cost of coverage, BenefitMAP helps employers better manage current healthcare costs, and project future costs to improve benefit program outcomes for a happier, healthier workforce.”
“The medical trend rate continues to exceed inflation rates, resulting in great uncertainty around the costs of providing a good standard of healthcare coverage to employees. With healthcare program costs rising significantly, employers need to find a balance between meeting their company’s expense expectations and caring for their workforce effectively.”
To learn more about BenefitMAP or watch the 2-min video, please click here.
-Ends-
Notes to Editors
* Data referenced does not include the US.
About Mercer Marsh Benefits
Mercer Marsh Benefits provides clients with a single source for managing the costs, people risks and complexities of employee benefits. The network is a combination of Mercer and Marsh local offices around the world, plus country correspondents who have been selected based on specific criteria. Our benefits professionals located in 135 countries and servicing clients in more than 150 countries, are deeply knowledgeable about their local markets. Through our locally established businesses, we have a unique common platform which allows us to serve clients with global consistency and locally unique solutions. Mercer and Marsh are two of the Marsh & McLennan Companies, together with Guy Carpenter and Oliver Wyman.
Chart 1: Compare a firm’s unique demographic and claims data to Mercer Marsh Benefit’s benchmarks – Demographics.
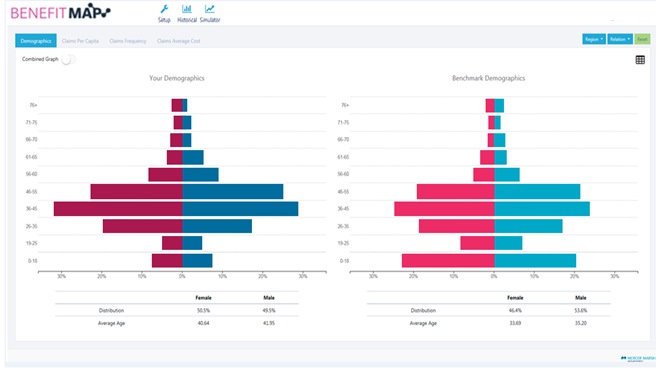
Chart 2: Compare a firm’s unique demographic and claims data to Mercer Marsh Benefit’s benchmarks – Cost and utilization.
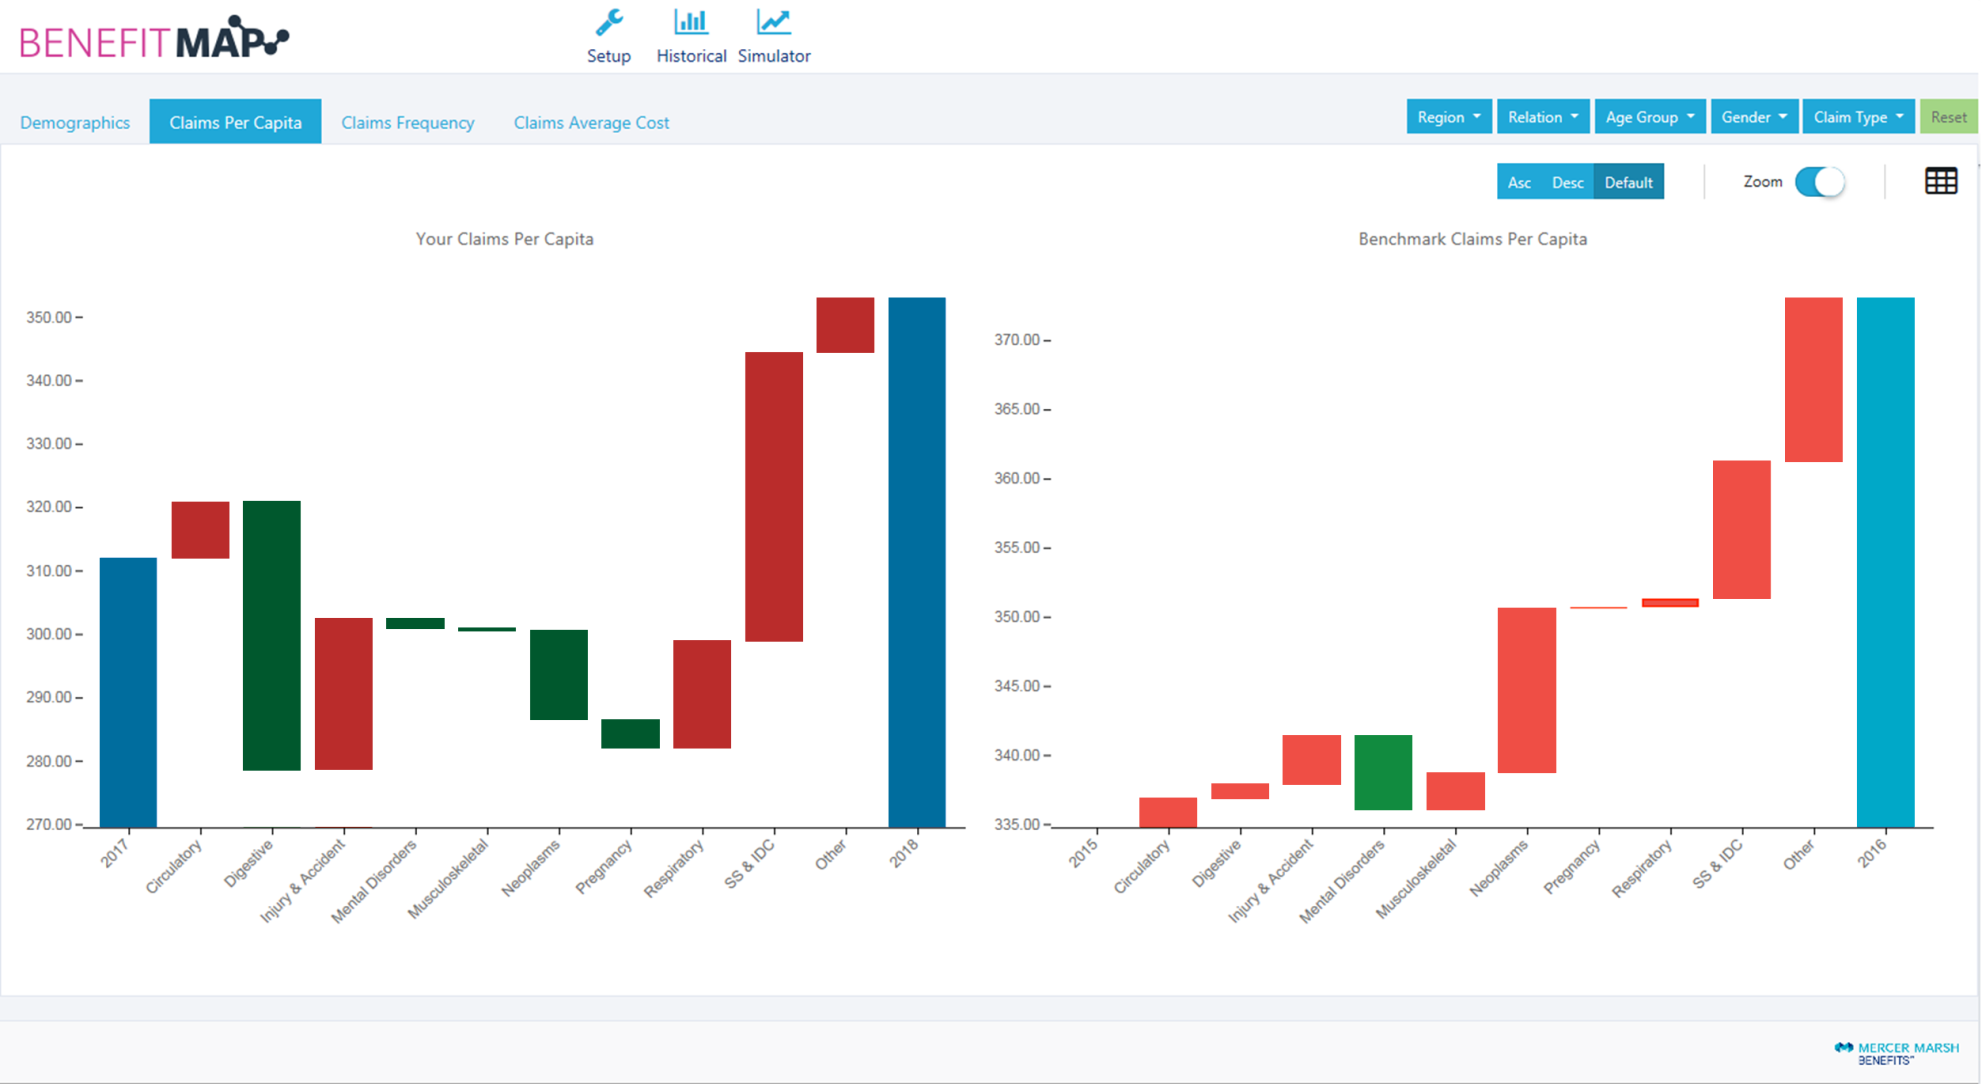
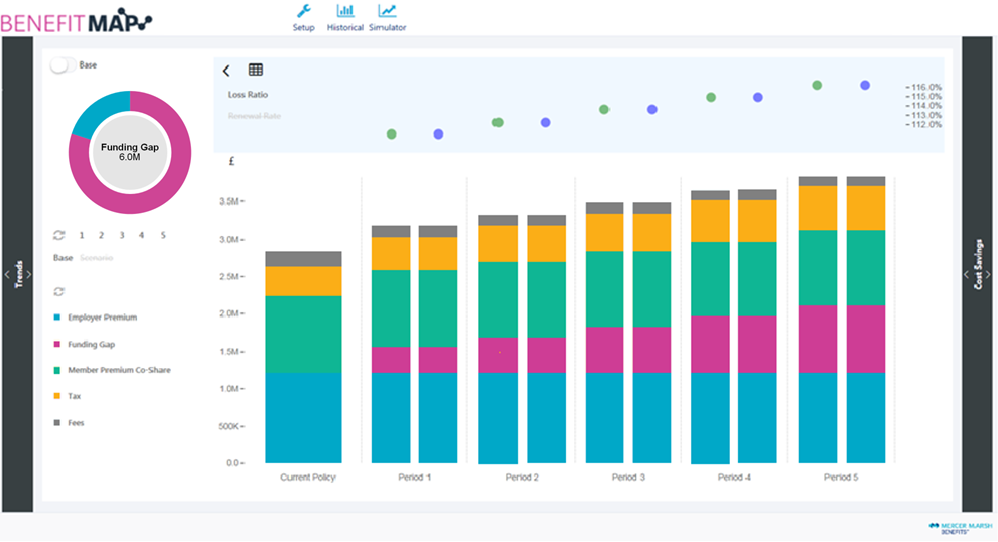
Chart 3: BenefitMAP delivers a transparent view into a company’s cost of coverage over the next 5-years.
[1] Mercer Marsh Benefits Medical Trends Around the World 2018 Survey